

How to manufacture a COVID ICU bed crisis
A look at the data from Ohio and the media reaction

This post is from my Facebook group dated September 20th, 2021. The text is materially the same as the original with minor edits in order to put the images in line with the text. While the data is older, these same games are still being played, and factor into the CDC’s current ‘Community Levels’ indicators.
In recent weeks we have been regaled with frightening stories of ICUs being full, particularly in southern Ohio and particularly with COVID. But as always when it comes to COVID data in the state of Ohio, there's more going on besides just that. Consider the 6 attached images.
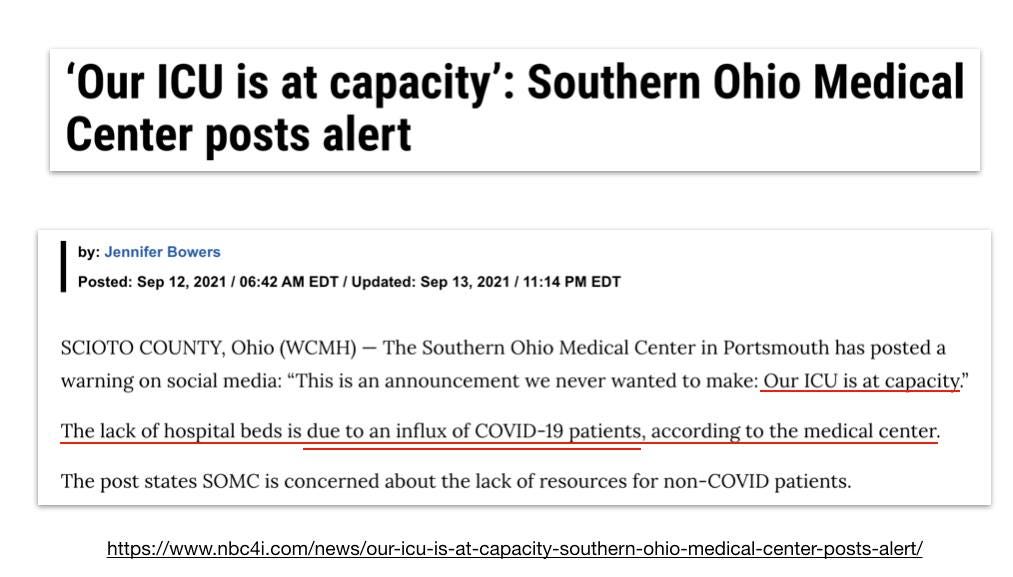
In the first we see a pretty typical news article about the ICUs being full, that your loved one will have no where to go if they needed it, etc. This article, and the hospital in question, firmly blames this lack of space on the influx of COVID patients.
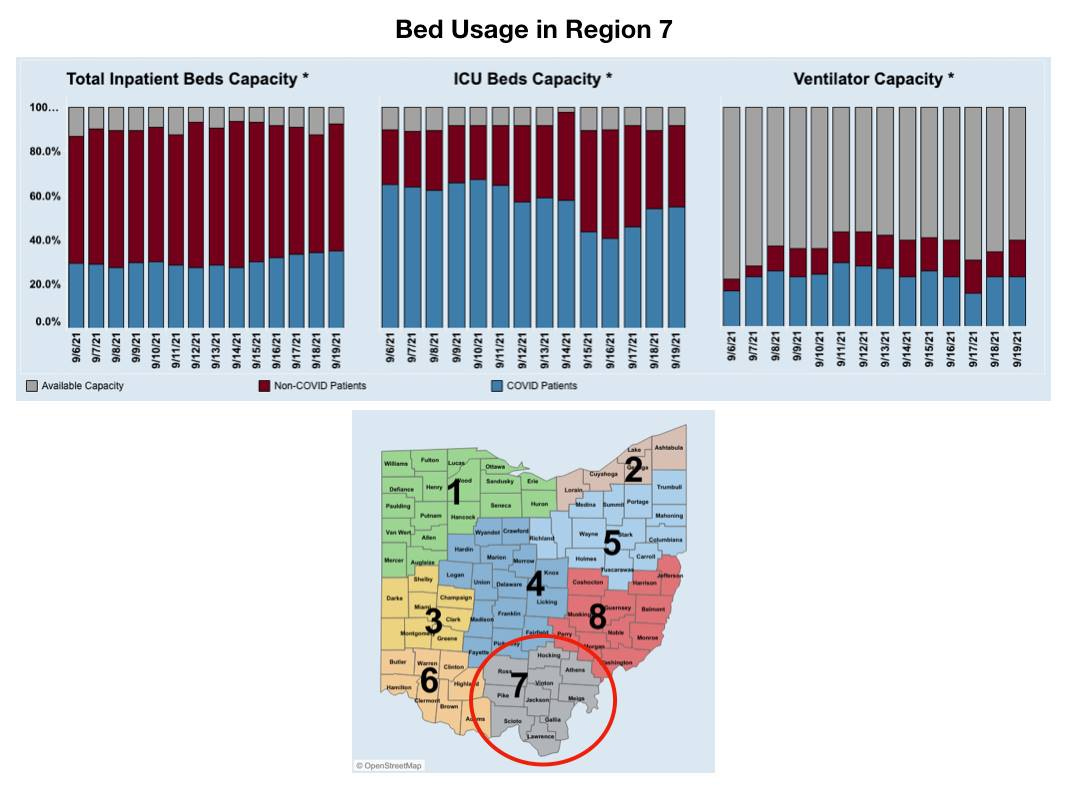
And indeed, when one looks at Ohio's dashboard today, the situation looks quite dire. The blue (COVID) absolutely is dominating the beds in the southern region of Ohio where Southern Ohio Medical Center is located. See below.
But what if we take a look back in time?
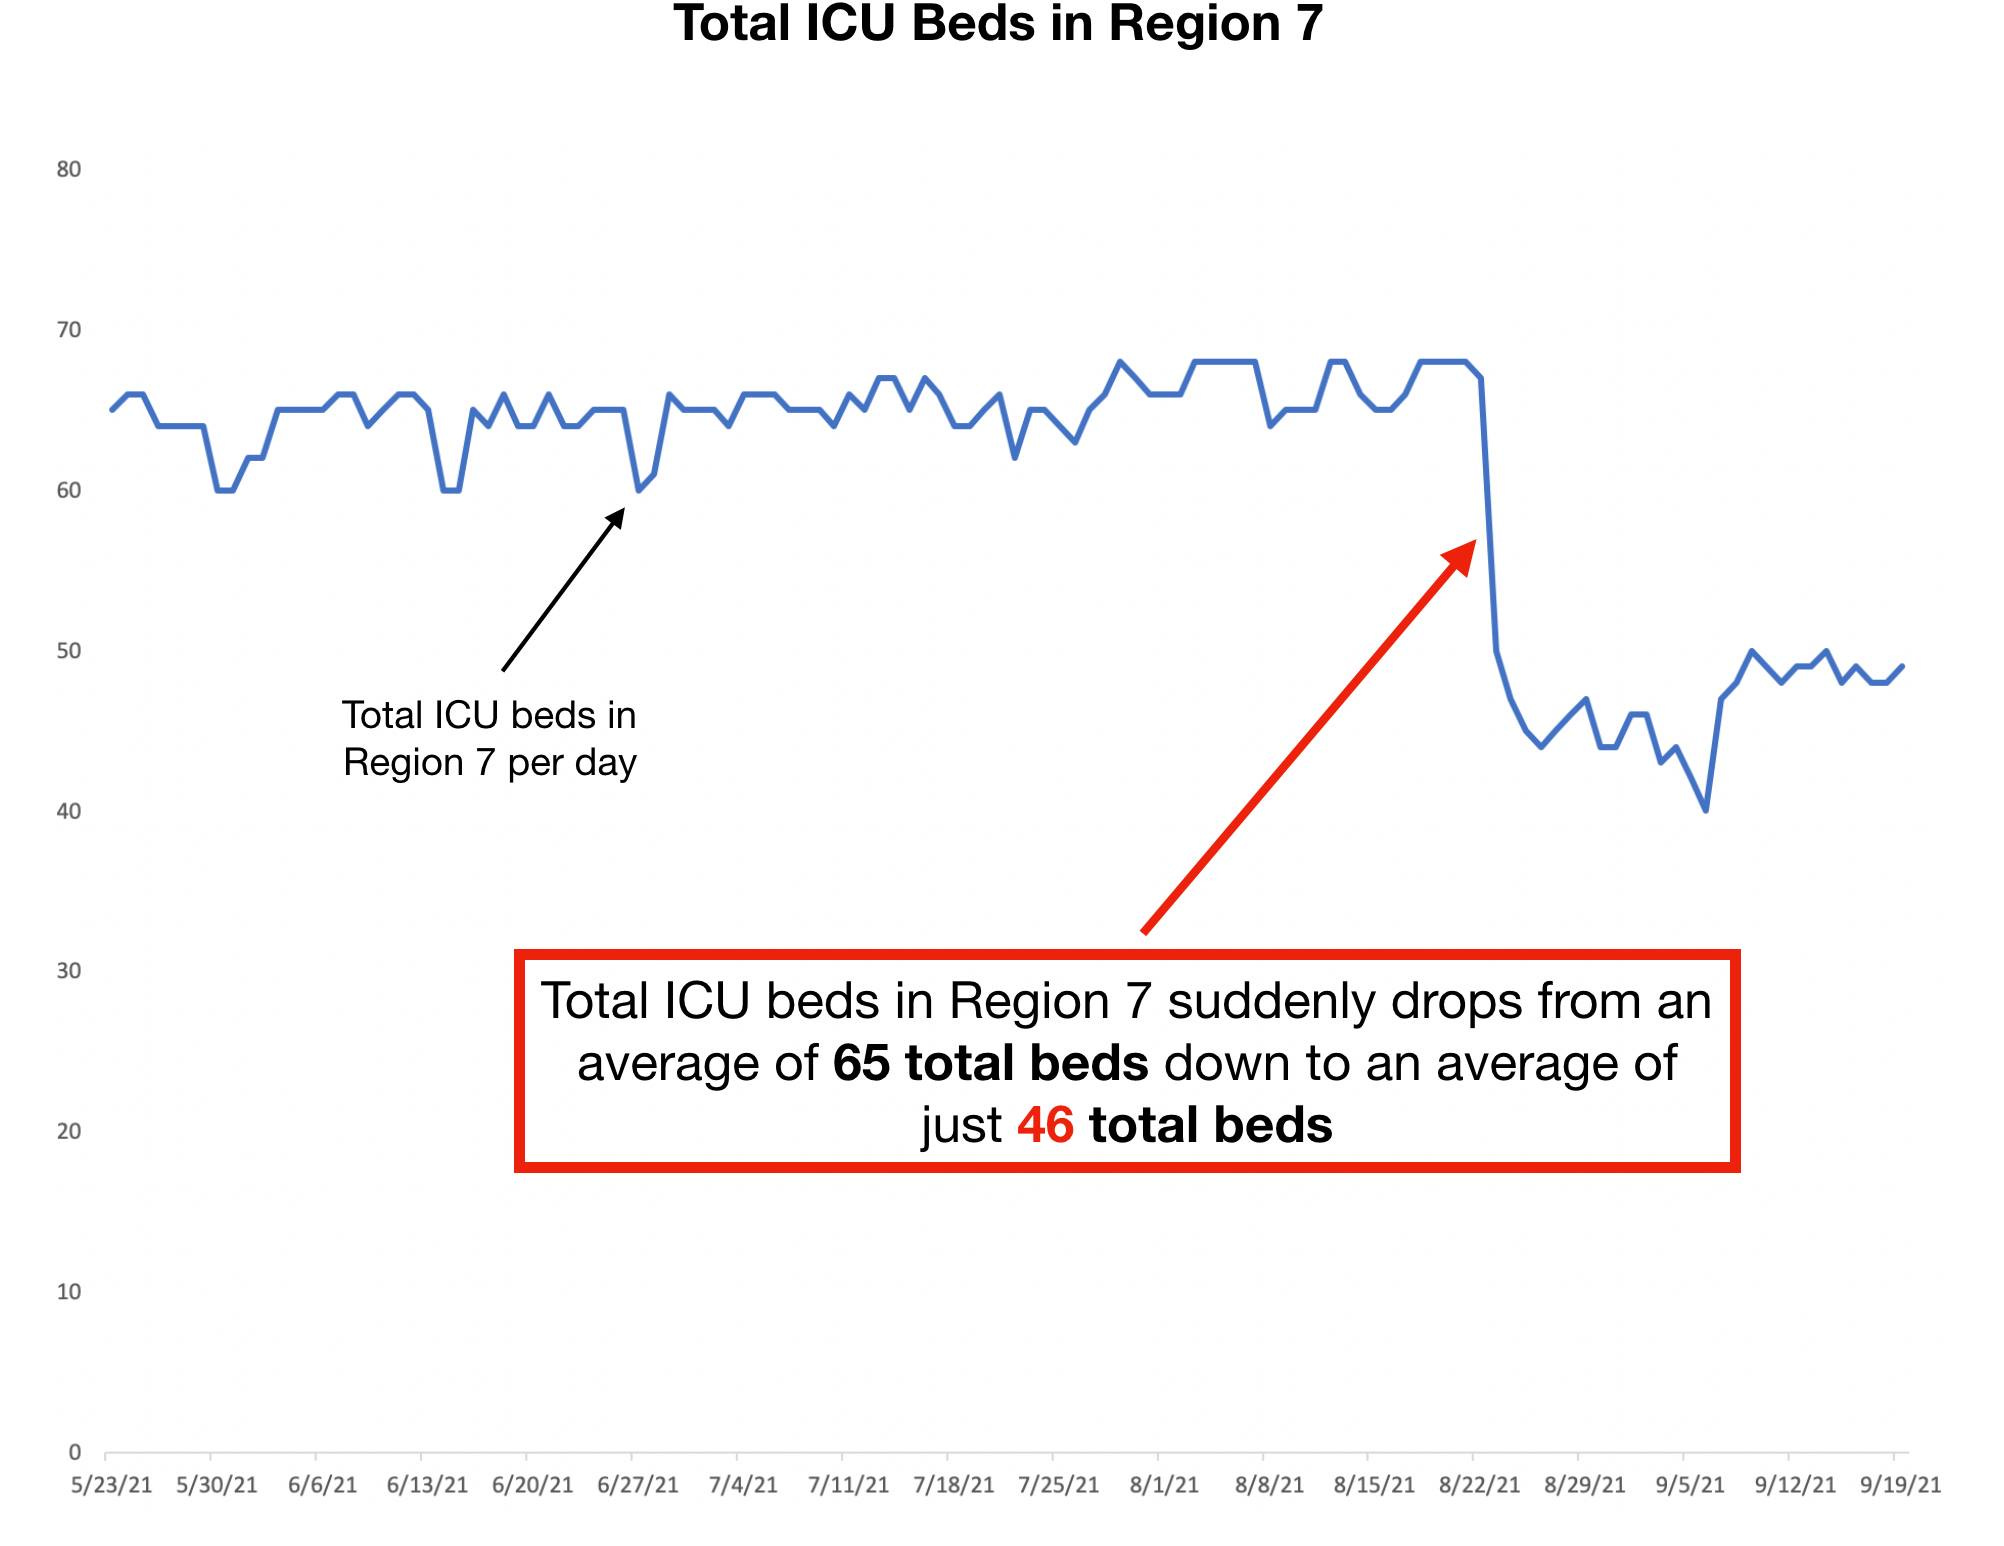
Below, I have plotted the number of total ICU beds in the region per day. This number fluctuates day to day due to staffing and the like, and minor fluctuations have been common throughout the pandemic. Until August 23rd.
On August 23rd, the total number of ICU beds in Region 7 dropped from a consistent average of about 65 beds down to an average of just 46 beds. According to the data the region lost 29% of their capacity overnight. That alone will obviously massively impact available beds.
But that's not all that has happened in Region 7 that is not consistent with the narrative. Consider the next image that examines non-COVID ICU bed usage (yellow) and COVID+ ICU bed usage (red). Note that through the summer ICU bed usage both non-COVID and COVID+ remained pretty consistent, until COVID+ started to rise again starting in late July/early August.
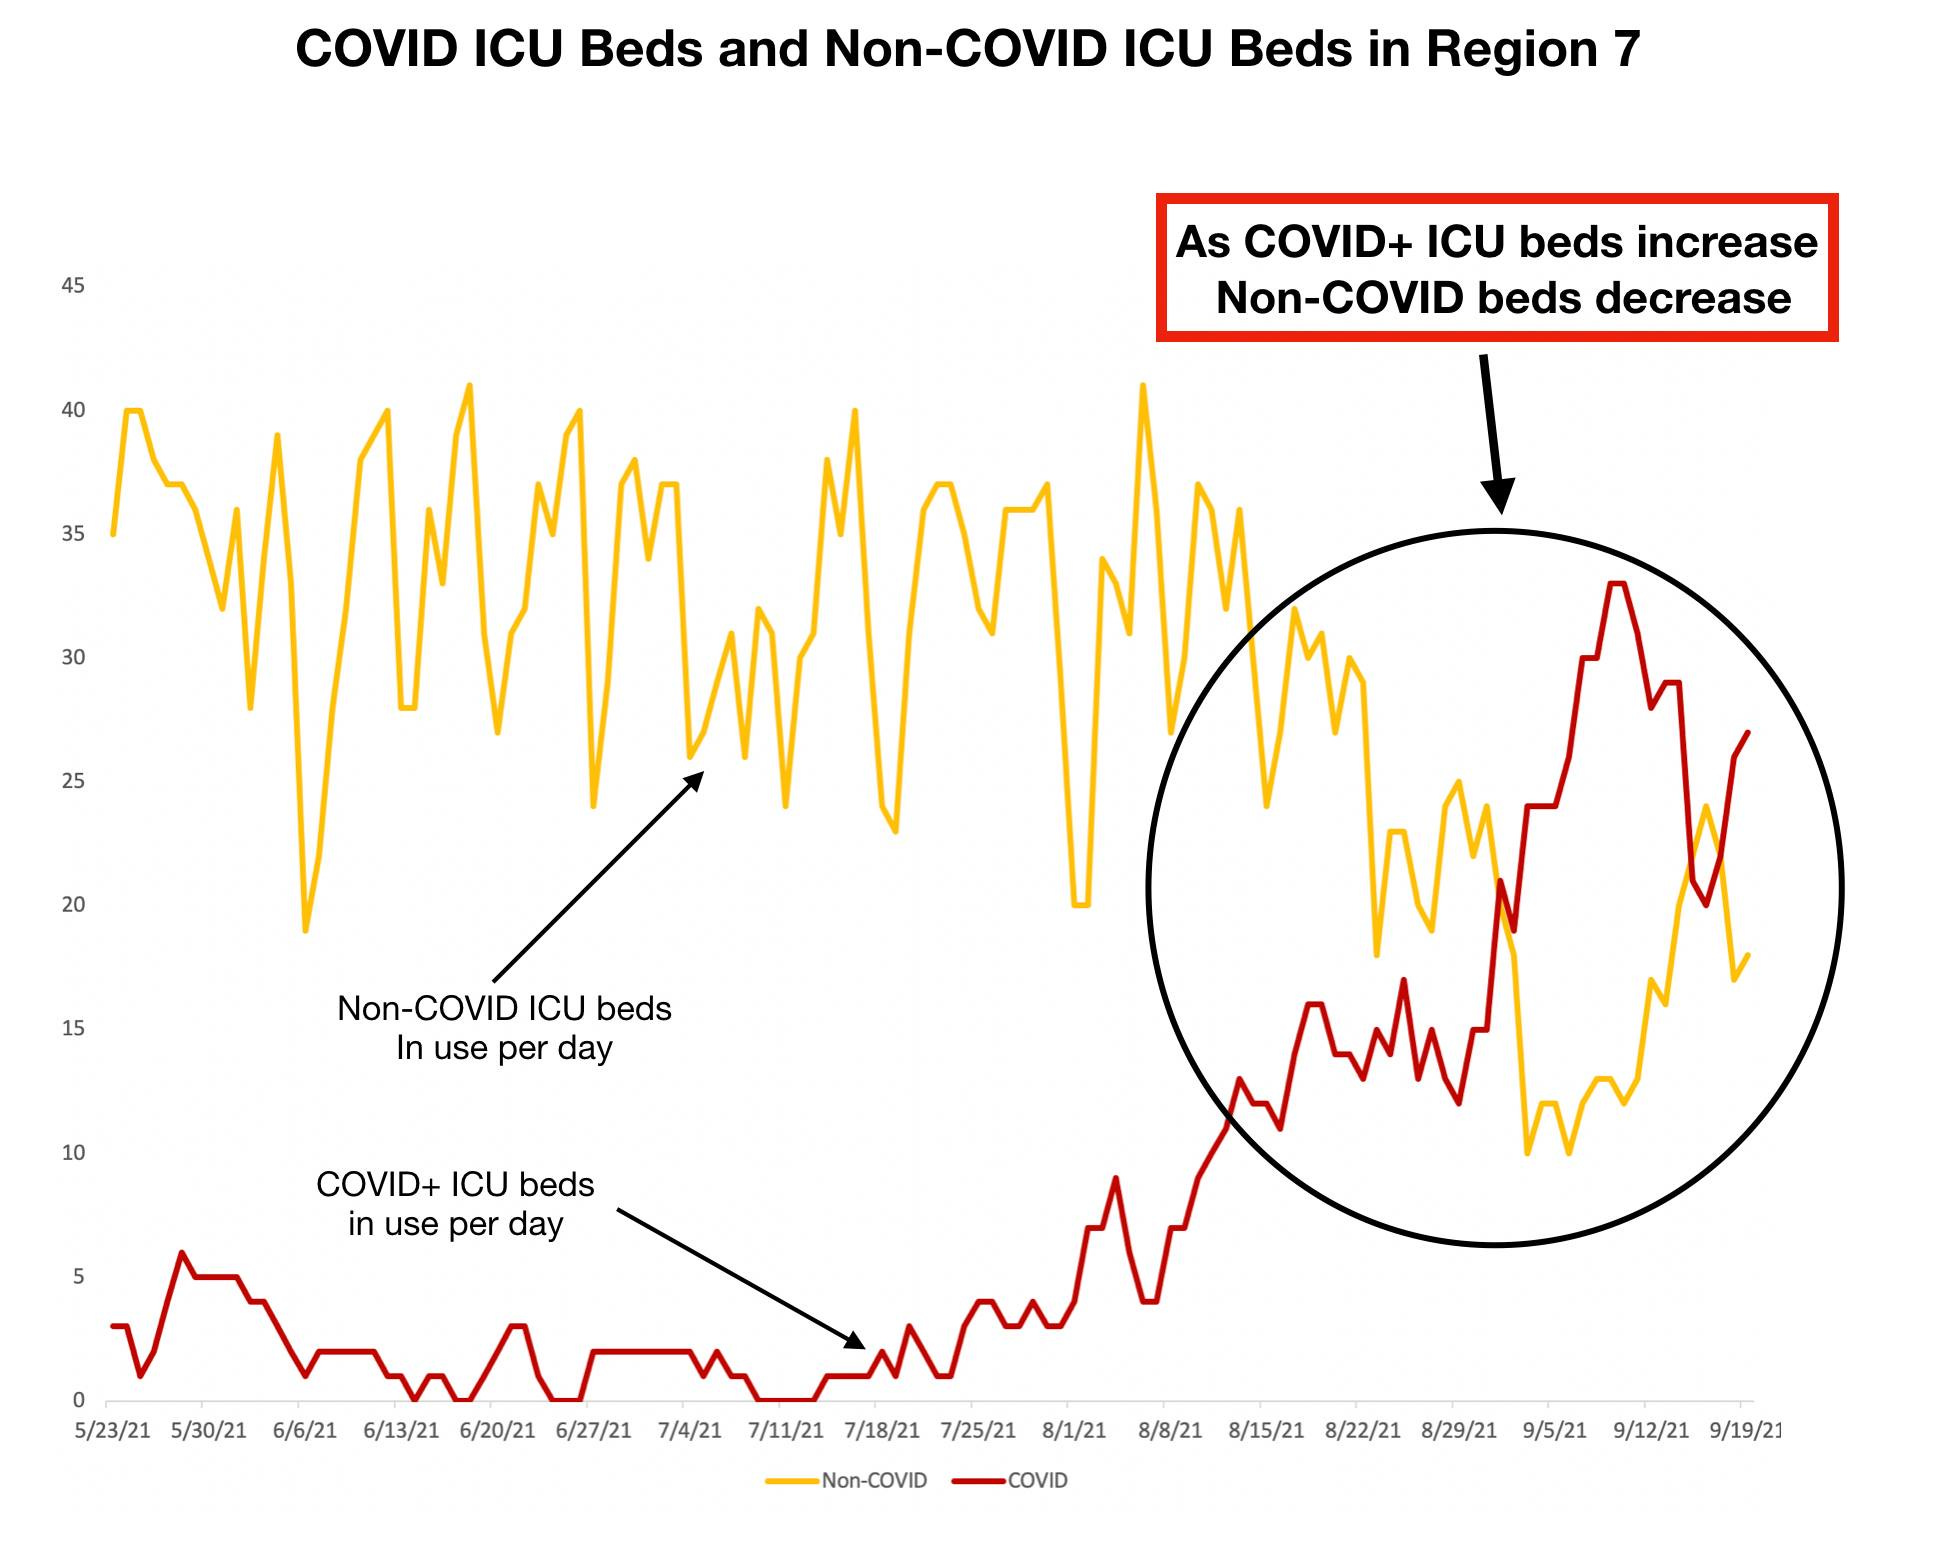
At first, non-COVID admissions look to have remained the same as COVID+ rose (which we expect with hospitalization for COVID) but then something funny happened. When COVID+ beds increased, non-COVID beds started to decrease. People do not suddenly and consistently have fewer heart attacks or fewer car accidents because other people become sick from COVID. What is happening here? The most logical answer is that more of the people coming in for those car accidents and heart attacks are testing positive on admission, and therefore counting as 'COVID'.
It is again critical to understand that the presence of a virus in the respiratory tract of a healthy person is not evidence of infection or infectiousness, particularly when population immunity to a virus is high and during that virus's normal circulation time. People will test positive without ever being infected or infectious if their immune system already recognizes the pathogen.
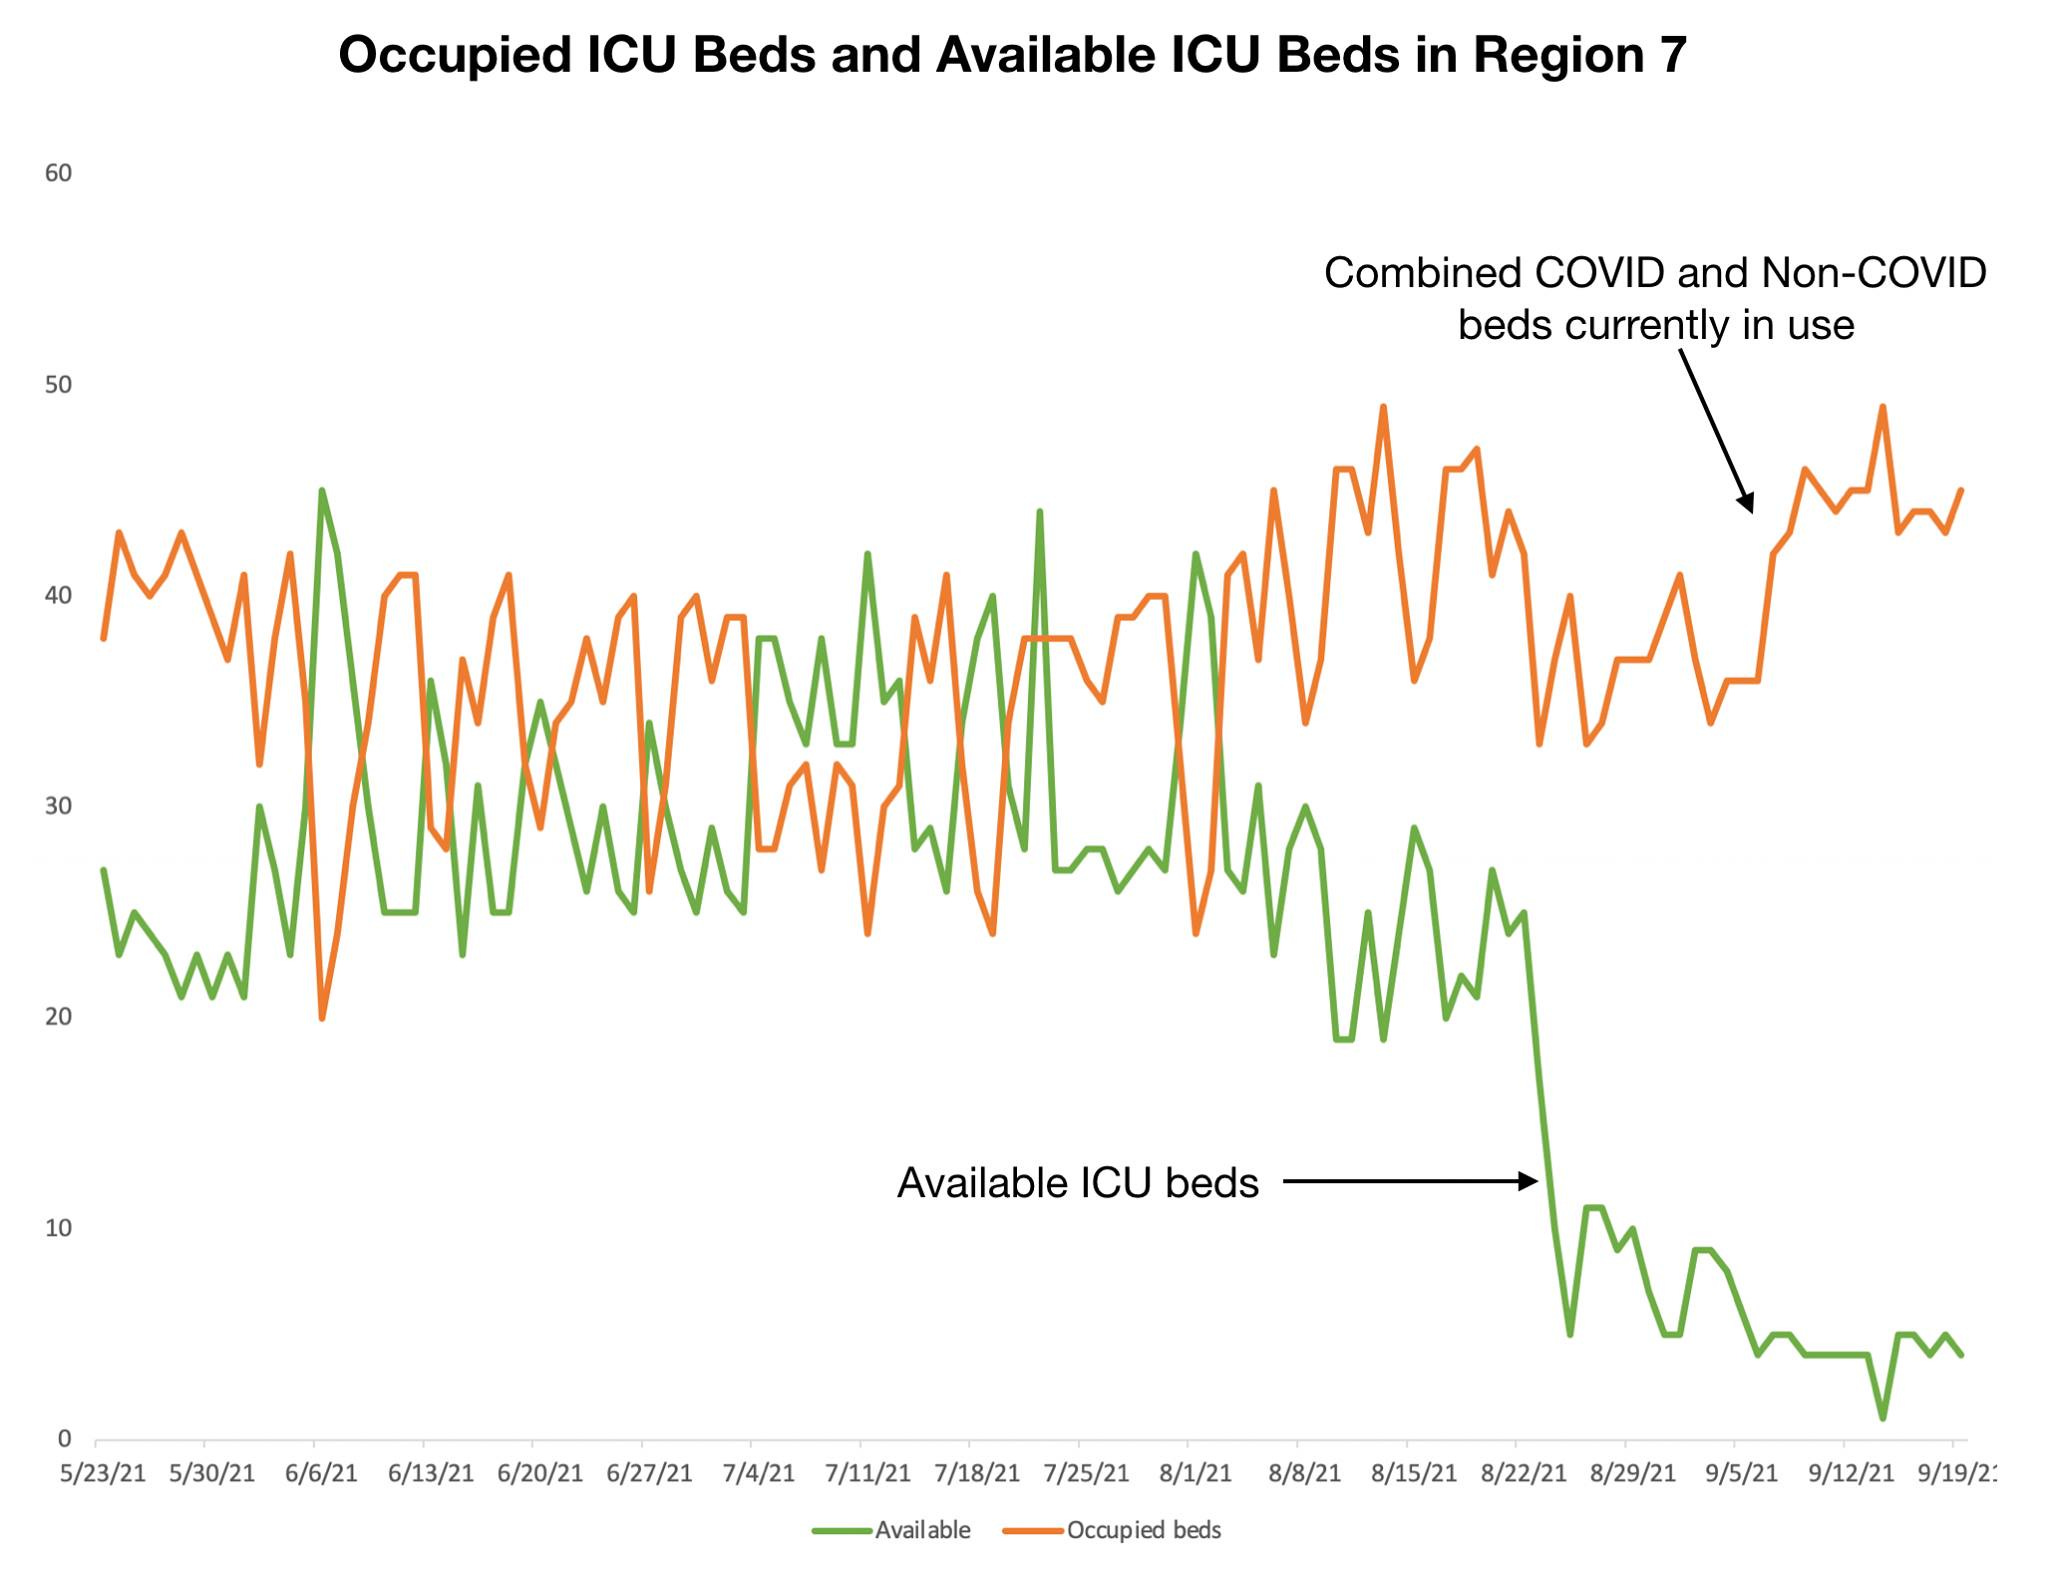
Interestingly enough, as can be seen in the next image, our total occupied beds (both COVID and Non-COVID together - orange line) have remained pretty stable since the end of May, with perhaps a small increase more recently. While our remaining available beds have dropped precipitously (green line).
Finally, I have attached a chart showing the change in bed numbers throughout this time period. We can see that when we calculate it out, this region has experienced, on average, an increase of <4 total ICU beds used since summer (and from 8/1 to 9/19, total bed usage slightly declined from 40.6 to 40.2)

What we see happening in Region 7 is not that COVID patients have severely added to this region's burden as the narrative tells us. Instead, the reality is that this region has lost nearly a third of its ICU bed capacity (most likely due to staff losses, which is a self-inflicted problem) and they are counting a larger number of those with other maladies as being 'COVID+'
Special thanks to all the 'data minions,' and in particular Jennie Spicer for collecting this data from the website so consistently for months.